Régis Vaillancourt, Mike P Zender, Laurie Coulon, Annie PouliotABSTRACT
Background
A panel of medication management experts previously identified 9 key medication safety issues and high-alert drug classes as representing the most pressing medication-handling issues in health care.
Objective
To develop medication safety pictograms depicting medication safety issues and high-alert drug classes that represent medication-handling risks for health care personnel.
Methods
An iterative design process, including activities such as semiotic analysis, design/redesign, and evaluation, was used to develop medication safety pictograms. Nurses, physicians, pharmacists, and students listed and drew graphic elements to depict each of the 9 key medication safety issues. Graduate students in graphic design developed the preliminary pictograms for the study. A Delphi survey was then conducted with experts recruited from the International Pharmaceutical Federation to reach consensus on the pictograms and provide feedback to the graphic designers. Health care providers from around the world were invited to participate in a survey to determine a preferred pictogram for each safety warning.
Results
For each medication safety issue, 3 to 5 pictograms were developed on the basis of graphic elements suggested by 52 health care providers. These pictograms were then presented to 58 experts in 2 rounds of a Delphi process. For each medication safety issue, consensus on the 2 best pictograms was reached and feedback provided. A total of 799 participants from 61 countries responded to the international preference survey. Most of the participants (n = 536, 67.1%) were Canadian, and of those, 385 (71.8%) were pharmacists. In 8 categories, consensus on the preferred pictogram was reached across the health care professions; however, a difference in preference was apparent for the pictogram representing “neuromuscular blocking agent”, with nurses’ preferred pictogram differing from the preference of other participants.
Conclusion
This project produced pictograms to illustrate 9 important medication safety issues, which can now be validated through comprehension and recall assessments. Further study can also determine their potential to reduce medication administration errors.
KEYWORDS: pictograms, medication safety
RÉSUMÉ
Contexte
Un groupe d’experts en gestion des médicaments avait auparavant établi neuf principales questions de sécurité des médicaments ou classes de médicaments de niveau d’alerte élevé qui méritaient l’attention la plus urgente en santé du point de vue de la manipulation des médicaments.
Objectif
Concevoir des pictogrammes de sécurité des médicaments qui illustrent adéquatement les questions de sécurité des médicaments et les classes de médicaments de niveau d’alerte élevé représentant des risques pour le personnel en santé lors de la manipulation des médicaments.
Méthodes
Un processus de conception itératif (comprenant des activités comme l’analyse sémiotique, la conception et la rectification, et l’évaluation) a été employé pour créer des pictogrammes de sécurité des médicaments. Du personnel infirmier, des médecins, des pharmaciens et des étudiants ont dressé une liste d’éléments graphiques qu’ils ont dessinés afin d’illustrer chacune des neuf principales questions de sécurité des médicaments. Des étudiants diplômés en graphisme ont conçu les ébauches de pictogrammes destinées à l’étude. Un sondage Delphi a ensuite été mené auprès d’experts recrutés au sein de la Fédération internationale pharmaceutique afin de dégager un consensus quant aux pictogrammes et de fournir des commentaires constructifs aux graphistes. Des fournisseurs de soins de santé de partout dans le monde ont été invités à répondre à un sondage pour déterminer quel pictogramme privilégier pour chacune des mises en garde.
Résultats
Pour chaque question de sécurité des médicaments, entre trois et cinq pictogrammes ont été conçus à partir d’éléments graphiques proposés par 52 fournisseurs de soins de santé. Ces pictogrammes ont ensuite été présentés à 58 experts au cours d’un processus Delphi à deux phases. Pour chacune des questions de sécurité des médicaments, un consensus sur les deux meilleurs pictogrammes a été atteint et des commentaires constructifs ont été émis. Au total, 799 participants de 61 pays ont répondu au sondage international sur leurs préférences. La majorité des participants (n = 536, 67,1 %) étaient Canadiens et parmi eux, 385 (71,8 %) étaient pharmaciens. Dans huit catégories, l’ensemble des professions ont atteint un consensus quant au pictogramme à privilégier. Cela n’a pas été le cas pour le pictogramme représentant les « bloqueurs neuromusculaires », car le personnel infirmier a privilégié un pictogramme différent de celui préféré par les autres professions participantes.
Conclusions
Ce projet a produit des pictogrammes pour illustrer neuf importantes questions de sécurité des médicaments. Ces pictogrammes peuvent maintenant être validés à l’aide de tests de compréhension et de mémoire. De plus amples études pourront aussi déterminer dans quelle mesure ces pictogrammes aident à réduire les erreurs d’administration de médicaments.
MOTS CLÉS: pictogrammes, sécurité des médicaments
Medication errors and adverse drug events occur frequently, producing substantial costs for treatment and further increasing already-burdened health care systems.1,2 Medication errors may occur at any point in the medication process— prescribing, transcribing, dispensing, or administration2,3—but studies have shown that the 2 leading sources of medication errors are prescribing and administration, with administration errors representing more than half of all errors.2,4–6 An analysis of the literature on medication errors and/or adverse drug events in hospital inpatients published between 1990 and 2005 showed that, on average, medication errors occurred in 5.7% of all episodes of drug administration.2 The reported number of medication errors is variable, because it depends greatly on the detection method used and the route of administration studied.2 For instance, IV administration of drugs is associated with the highest frequency of errors.2
Medication administration errors in hospitals have been analyzed to determine causation. Multiple factors contribute to medication administration errors, ranging from inadequate written communication to staff working conditions.7 Medication errors are strong risk factors for preventable adverse events or reactions and remain unacceptably high; therefore, strategies to reduce medication errors could potentially decrease serious adverse events.2,3,6,8 Various interventions, such as computerized prescriber order entry (CPOE), have been developed to reduce medication administration errors.9 However, despite technological advancements, a review of the literature estimated that the rate of dispensing errors was between 0.04% and 24% in community pharmacies and between 0.008% and 18% in hospital pharmacies. 10 Given the complex processes involved in administration of medicines, reducing medication administration errors requires a multifaceted approach involving both education and risk management strategies.11
Pictograms, when combined with training, can be used as tools for improving medication management by health care providers.3,12 Pictograms are graphic representations of concepts or ideas that can be used to communicate messages to a wide audience. They are considered advantageous in communicating messages because they can represent information regardless of language or literacy skills and can do so in a compact manner.12,13 In the development of pictograms, researchers should connect to the existing knowledge of the users, gain the attention and hold the interest of the learner, and present the information in a way that helps the learner to remember.14 There are 2 elements to every pictogram: a symbol (the graphic representation) and a referent (the intended meaning).12,13,15 The referent can be context dependent and culture mediated; therefore, context and culture must be reflected in the design and implementation of a pictogram.16 As an example, one of the most striking social innovations in recent years—the emoji—was originally introduced by Japanese telecom carriers in 1999.17 Emojis have been adopted into online conversations and have become a universal language used across the world through multiple platforms and applications.17,18
Nonverbal symbols such as pictograms are increasingly being recommended to convey warnings and safety information. It is common to find warning signs and labels on consumer products.12,14,19 In health care, pictograms have been shown to improve comprehension, recall, and adherence among patients for whom medications have been prescribed.3,20 Cautionary pictograms from the Globally Harmonized System of Classification and Labelling of Chemicals are being used by the Workplace Hazardous Materials Information System to increase workplace safety during the handling of chemicals.21 A similar tool for medication handling by health care providers could have great benefit for medication safety, especially during medication administration.
The development and testing of pharmaceutical pictograms involves a stepwise approach that must follow standardized processes.12,22 Pictogram development begins with the identification of the explicit information needs or behaviour changes necessary within a target audience.12 Once the messages to be depicted have been identified, a pool of pictograms is generated and then tested to determine whether the proposed pictograms convey the intended message.12 Validation of the pictograms within the target audience is then performed, with redesign as indicated.12
In a previous study,3 a panel of medication management experts identified 9 key medication safety issues and high-alert drug classes that represent the current most pressing medication-handling issues in health care (Table 1). Building on that study,3 the objective of the current project was to use feedback from health care providers in developing pictograms to depict these 9 complex medication safety issues and then to survey preferences for the draft pictograms in an international sample of health care providers.
Table 1 Top 9 Medication Safety Issues Previously Identified Through a Delphi Process3
A semiotic analysis using “List It” and “Draw It” methods was conducted to determine the key graphic elements for each of the safety messages to be conveyed. Semiotic analysis is the study, through breakdown and analysis, of the key components making up an image and how the population perceives them.23 A questionnaire was distributed to nurses, physicians, pharmacists, and health care students from the Children’s Hospital of Eastern Ontario (CHEO) in Ottawa, Ontario. Participants were asked to list and draw graphic elements that could help to depict each of the 9 medication safety issues in response to the following 2 questions: “Which graphic elements should be included in the pictograms?” and “How would you draw this issue/message?”
Through an iterative process and in collaboration with a group of pharmacists and experts in health communication at CHEO, graduate students from the School of Design, University of Cincinnati, in Cincinnati, Ohio, designed between 3 and 5 pictograms for each of the 9 medication safety issues using the graphic elements and the feedback received from the “List It” and “Draw It” surveys in Phase 1.
The Delphi method is a technique used to reach a reliable consensus in a group of experts.24 The Delphi method involves a series of 2 or more surveys, called “rounds”, in which a panel of experts provides their opinions on a question. After each round, the panelists receive aggregated information on the responses of the full panel, and are then asked follow-up questions in the next round. The process continues until consensus is reached.24
An invitation to participate in selecting medication pictograms was sent through the Hospital Pharmacy Section of the International Pharmaceutical Federation (FIP). Interested participants, who self-identified as being experts in medication management, were invited to complete a modified Delphi survey to reach consensus on their preferred pictograms and to provide feedback for the graphic designers to improve the pictograms.
Participants were presented with the pictograms developed in Phase 2 and were asked to rank the pictograms from their most preferred (first choice) to least preferred (fifth choice) pictograms and to provide comments on how to improve them. After refinement by the designers, a new set of pictograms depicting the medication safety issues was presented to the group of experts for another round. The experts were asked to select 2 preferred pictograms for each medication safety issue and to again provide feedback on the proposed pictograms.
An international preference survey was conducted to determine which of the 2 top pictograms identified during the Delphi survey best depicted each of the 9 medication safety issues. Health care professionals involved in medication management were targeted for this survey. The online survey invitation was sent electronically to participants through mass distribution using a snowball sampling strategy. An invitation was sent to the FIP, which forwarded the invitation to its membership and also to the World Health Professions Alliance for forwarding, in turn, to its membership. Among the member organizations of the World Health Professions Alliance are the International Council of Nurses and the World Medical Association. In Canada, the Medbuy hospital pharmacy directors group, the Institute for Safe Medication Practices Canada, and the Medication Safety Pharmacy Specialty Network of the Canadian Society of Hospital Pharmacists received an e-mail invitation to participate in the study and were asked to distribute the invitation within their respective networks. We expected to reach about 5000 health care workers. Pharmacy technicians, pharmacists, nurses, and physicians were the principal groups of potential participants.
Respondents who agreed to participate in the international preference survey were asked to select the pictogram that best represented each medication safety issue and to provide comments on how to improve the pictograms.
Ethics approval for the project was obtained from the CHEO Research Ethics Board before project initiation. Participants did not receive any incentive to participate. Development of the pictograms and data collection took place in Ottawa, Ontario, over a 6-month period (February 2016 to July 2016). REDCap (Research Electronic Data Capture), a secure web-based application designed to build and manage surveys and databases,25 was used to administer the surveys. The Statistical Package for the Social Sciences (SPSS version 23.0, IBM, Armonk, New York) was used to analyze the demographic and descriptive data. Categorical variables were summarized using frequencies and percentages.
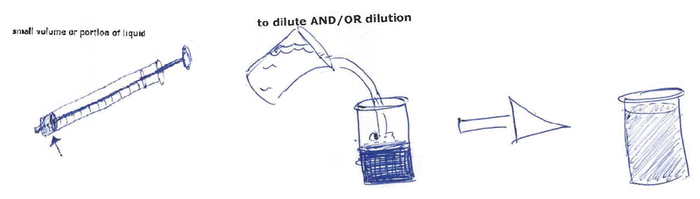
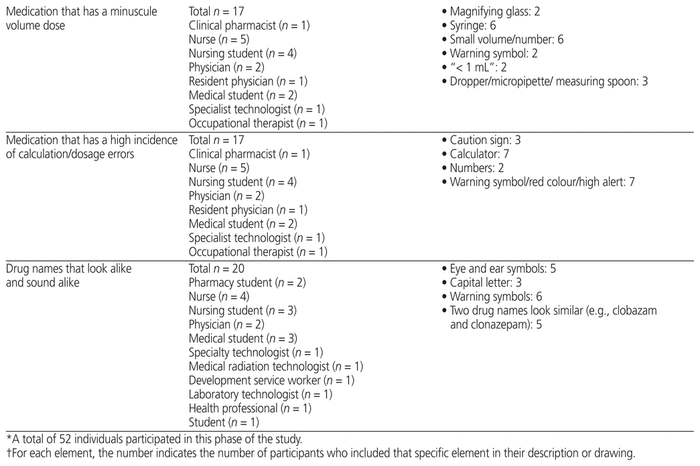
Fifty-two health care professionals from CHEO provided feedback for any of the 9 medication safety issues for which they had ideas. They suggested elements to include in pictograms (Table 2) and suggested how to draw the pictograms (providing their own drawings) (Figure 1). Participants in this phase were nurses, physicians, pharmacists, pharmacy technicians, dieticians, development service workers, and medicine, pharmacy, and nursing students.
Table 2 Key Graphic Elements Identified for Inclusion in Pictograms*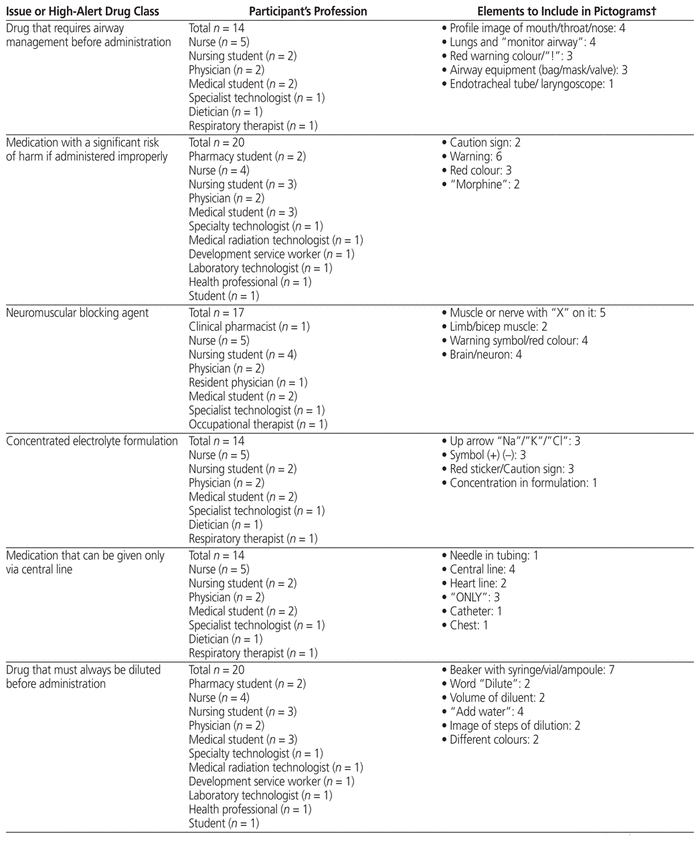
|
|
||
|
Figure 1 Examples of hand drawings from “Draw It” survey. continued on page 249 |
||
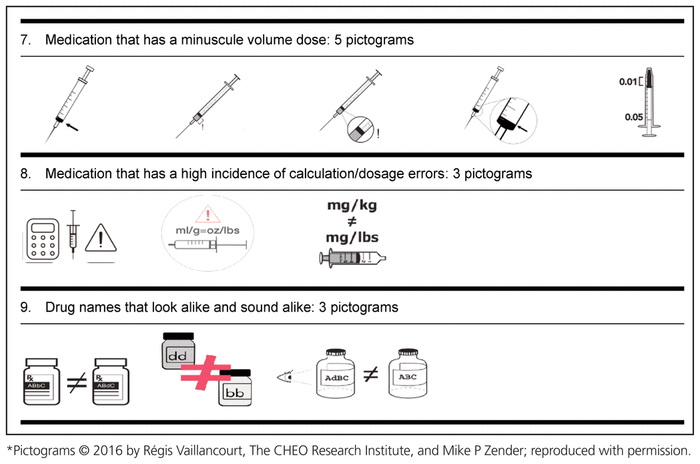
Based on the suggestions of these 52 health care workers from CHEO, in collaboration with the School of Design, University of Cincinnati, 3 to 5 pictograms for each medication safety issue were developed (Table 3).
Table 3 Medication Safety Pictograms Developed for Consideration in the International Consultation Survey (Phase 2)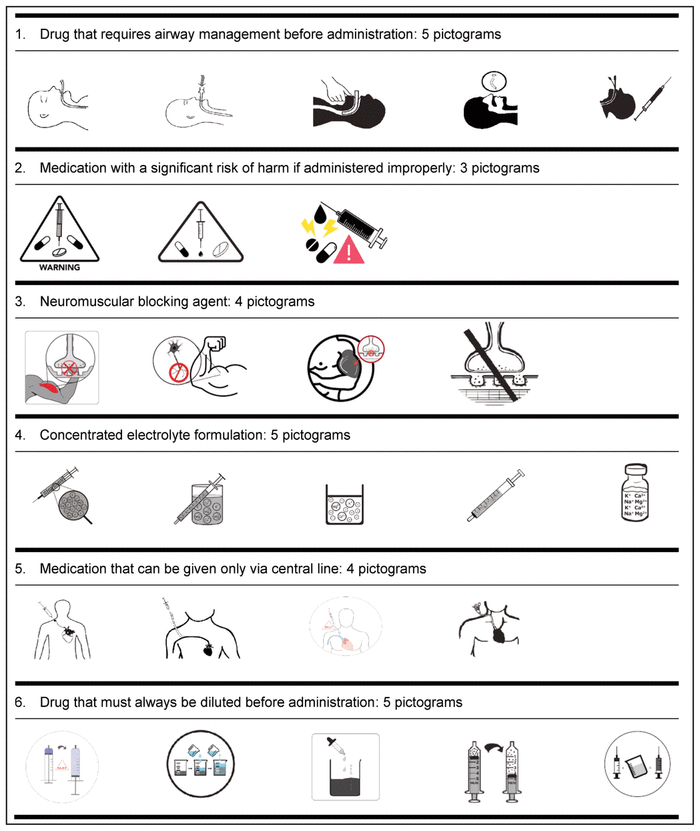
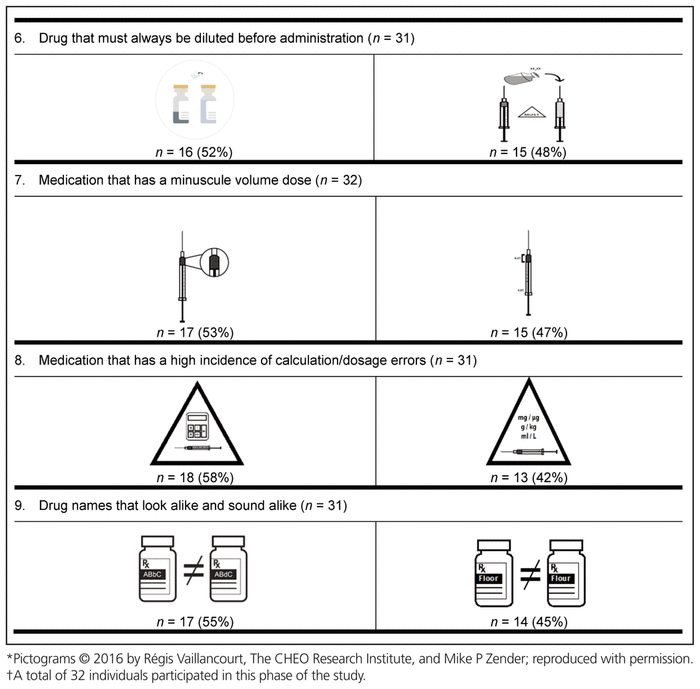
The international Delphi process began with 58 participants and involved 2 rounds (Table 4). The distribution of health care providers was 32 clinical pharmacists (55%), 20 pharmacy managers (34%), and 6 other health care professions (10%). Although 58 participants participated in the Delphi survey, they were not obliged to provide input on all 9 medication safety pictograms.
Table 4 Delphi Round 1 Pictograms, Ranked First and Second, with Participant Comments*,†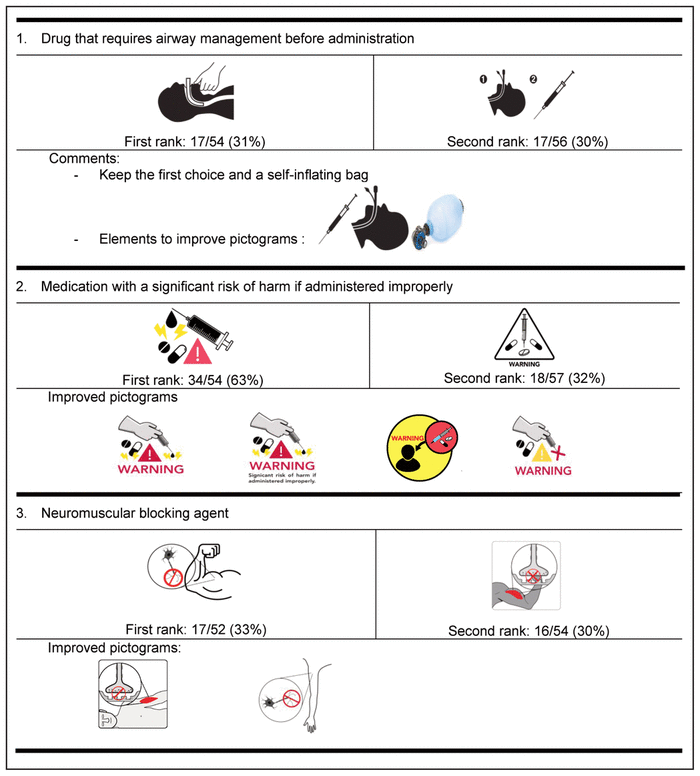
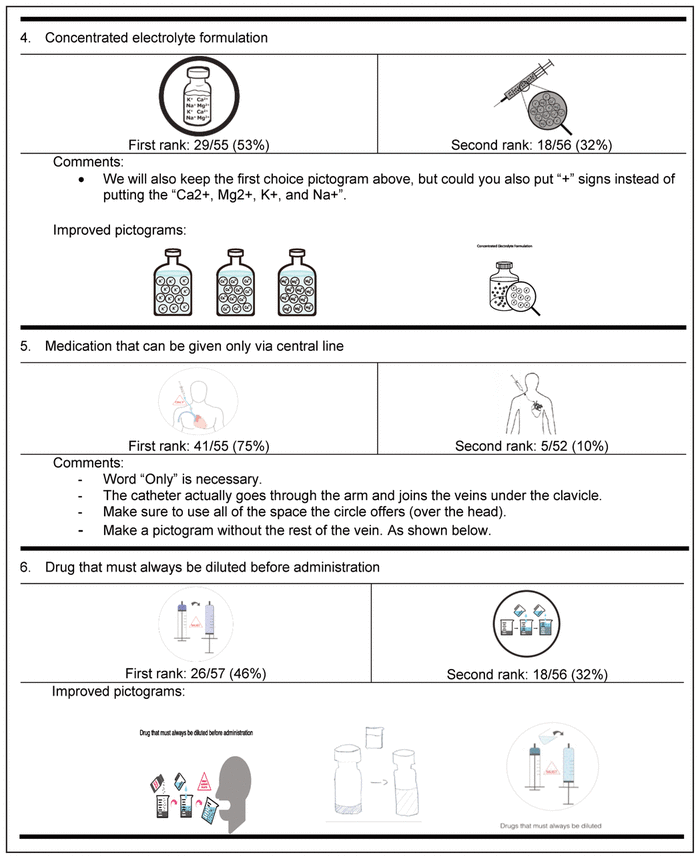
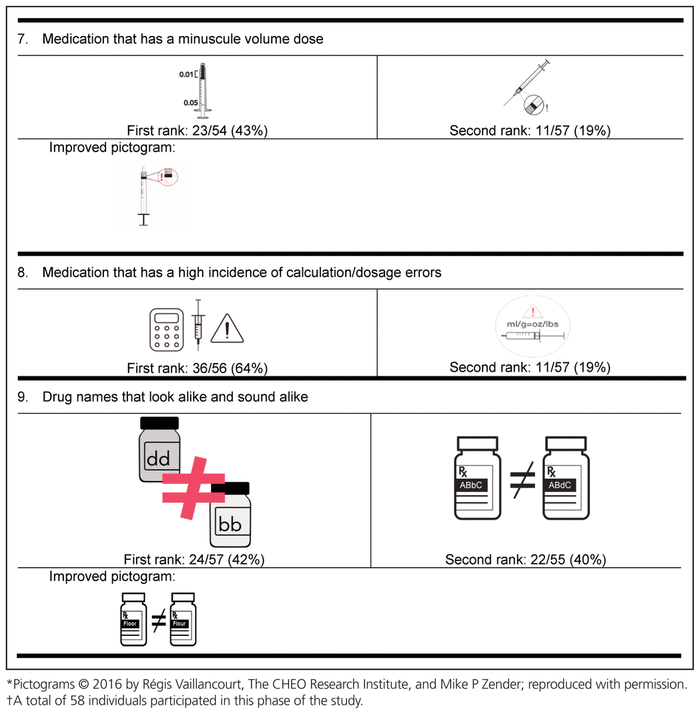
For the first round, pictograms were ranked according to preference, where 1 represented the most preferred pictogram. The 2 pictograms that most often received a first-choice ranking were selected for inclusion in the second round of the Delphi process. In addition, the pictograms were improved between rounds to reflect the comments from round 1. Of the initial group of 58 experts, 32 (55%) participated in the second Delphi round (Table 5).
Table 5 Preferred Pictograms as Determined in Delphi Round 2*,†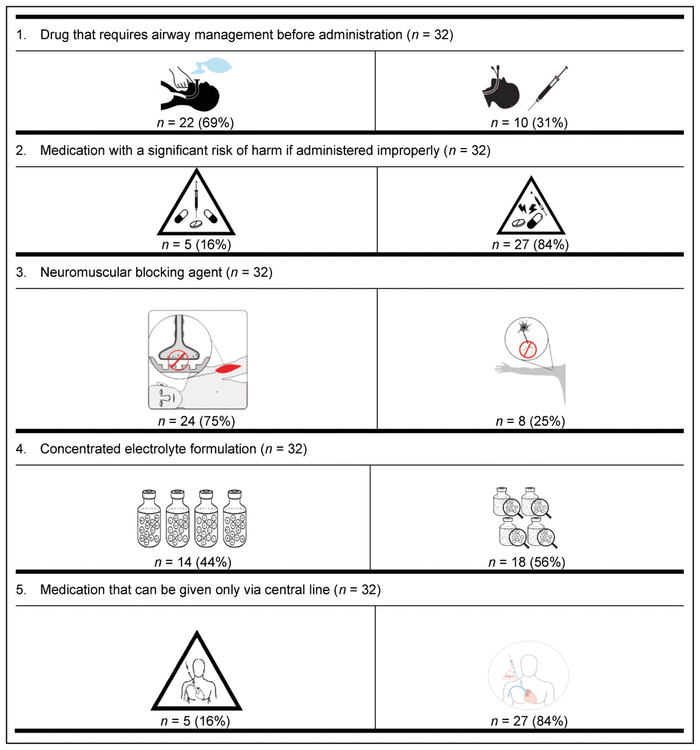
Finally, the preferred pictogram for each of the 9 medication safety issues was identified through the international preference survey (Table 6). A total of 799 health care providers from 61 countries participated in this final phase of pictogram selection. The following countries were represented: Canada (n = 536, 67.1%), Republic of Ireland (n = 41, 5.1%), Nigeria (n = 36, 4.5%), United States (n = 19, 2.4%), Australia (n = 17, 2.1%), Malta (n = 17, 2.1%), Denmark (n = 10, 1.3%), Germany (n = 7, 0.9%), Ghana (n = 6, 0.8%), the Netherlands (n = 6, 0.8%), and the Philippines (n = 6, 0.8%). The remaining 98 participants (12.3%) were from 50 other countries, with 1 to 5 participants per country. These countries were Albania, Argentina, Austria, Brazil, Chile, China, Costa Rica, Croatia, Czech Republic, Ecuador, Finland, France, Gabon, Greece, Haiti, Hungary, India, Indonesia, Iraq, Japan, Jordan, Latvia, Macedonia, Malaysia, Montenegro, New Zealand, Norway, Oman, Pakistan, Qatar, Romania, Russia, Saudi Arabia, Serbia, Singapore, South Africa, South Korea, Spain, Sri Lanka, Sweden, Switzerland, Taiwan, Thailand, Turkey, Ukraine, United Arab Emirates, United Kingdom, Uruguay, Yemen, and Zimbabwe. Among the health care providers who participated were 572 pharmacists (71.6%), 101 nurses (12.6%), 62 pharmacy technicians (7.8%), and 43 physicians (5.4%). Among the 536 Canadian participants, 385 (71.8%) were pharmacists.
Table 6 International Preferences for Medication Safety Pictograms*,†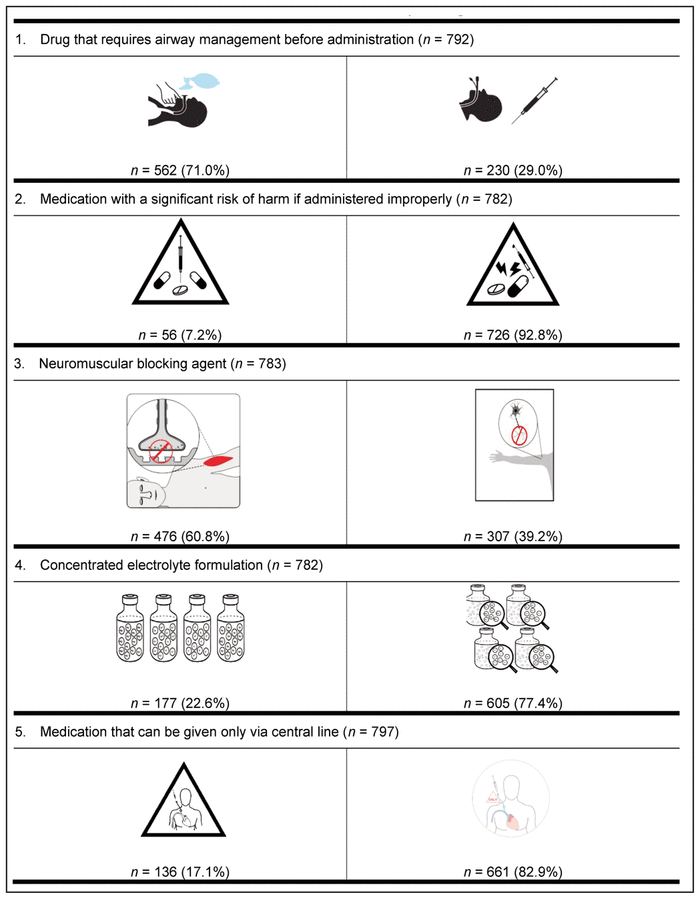
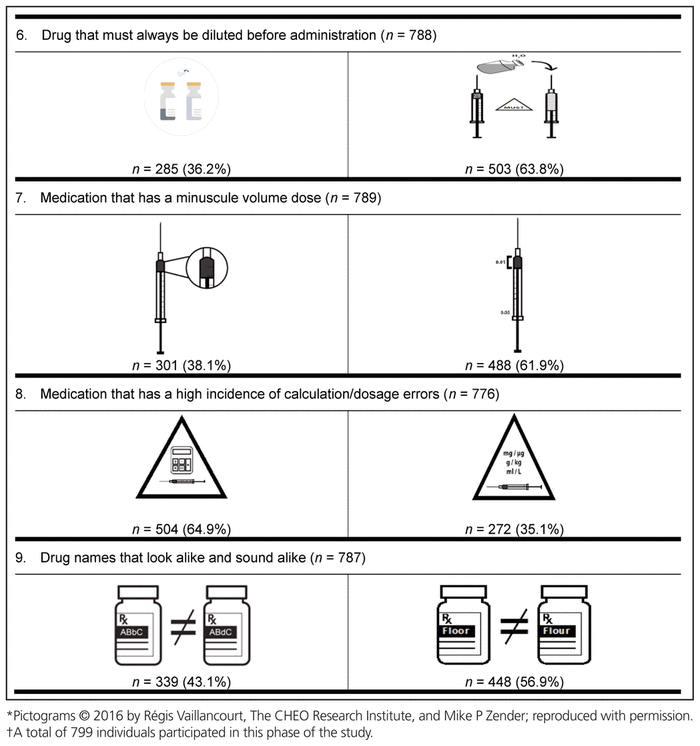
For 8 of the 9 medication safety issues, members of each profession preferred the same pictogram; however, a clear consensus was not reached on the preferred pictogram for neuromuscular blocking agents. More specifically, nurses preferred a different pictogram from that preferred by all other participants.
Pictograms have been used for many years as a way to illustrate safety-related messages on consumer products such as toys, clothes, and food. Warning signs could also be used to help mitigate risk related to the administration of medications. To the authors’ knowledge, this is the first study to specifically design pictograms for health care professionals warning of important medication administration errors and to test preferences for these pictograms internationally. Following best practice recommendations, we developed a comprehensive and iterative design process for the pictograms, because studies have shown that poorly designed pictograms may be poorly understood.26 In particular, we followed the steps proposed by Montagne and identified key issues and elements in medication safety to be targeted for pictogram design.3,12
For 9 medication safety issues and high-alert drug classes established by consensus, in an earlier study, as being most important for medication safety, we designed between 3 and 5 pictograms using the “Draw it” and “List it” methodology and redesign by graphic designers. For each issue of concern, we selected the 2 pictograms that garnered the most “first choice” votes from a panel of experts. This method did not consider the accumulation of all ranks, a method that could produce different results.
The “List It” and “Draw It” methodology allowed the graphic designer to include important elements that might not have been independently identified by the group of experts or the graphic designer. It provided a wider range of suggestions and accelerated the process of obtaining the final pictogram. However, some of the medication safety issues were very challenging to represent visually (e.g., “medication that requires airway management before administration” and “medication with a significant risk of harm”). These pictograms were designed in a more abstract way, and users will likely require education in order to understand them. The literature suggests a strong correlation between the complexity of a message and the level of comprehension,27 which means that for complex messages, a lower level of comprehension is typically observed. In the case of pictograms for the 2 issues that were particularly challenging to represent, we anticipate lower comprehension in the validation phase, because of the complexity of the messages we are trying to convey. Nonetheless, the aim of these pictograms is to warn health care professionals of possible danger, and it might be possible to test for the perception of danger, along with comprehension of the specific pictograms.
This study had a number of limitations. First, the international Delphi consultation included only pharmacists but might have benefited from inclusion of practitioners in other health care professions involved in the administration of medications. The international survey also lacked substantial numbers of participants from developing countries, with most participants coming from Canada. This is a limitation in the sense that the pictograms are primarily based on materials and procedures from Canada and the United States.
Finally, this study did not look at comprehension of the pictograms that were developed. This step is crucial in the identification of pictograms that can be used in practice.12 Instead, this project started with multiple designs for each safety issue, so as to present multiple choices to health care providers. We also thought that selecting the preferred pictogram using an international sample of health care providers would help in designing more internationally recognized and accepted pictograms. The next step will be to test these pictograms for comprehension using standards of the International Organization for Standardization (ISO) to validate these pharmaceutical safety pictograms for use around the world.22 The ISO standards require that at least 66% of participants be able to comprehend a pictogram without explanation.
This study has presented international preferences for pictograms developed for 9 issues identified by Canadian experts as safety risks in the management and administration of medications. Testing of these pictograms for comprehension is the next step before their implementation in practice.12,28 Future studies will look at rates of comprehension for these pictograms and rates of recall after participants are trained on their meaning.
1 Bates DW, Cullen DJ, Laird N, Petersen LA, Small SD, Servi D, et al. Incidence of adverse drug events and potential adverse drug events. JAMA. 1995;274(1):29–34.

2 Krähenbühl-Melcher A, Schlienger R, Lampert M, Haschke M, Drewe J, Krähenbühl S. Drug-related problems in hospitals: a review of the recent literature. Drug Saf. 2007;30(5):379–407.
3 Vaillancourt R, Pouliot A, Streitenberger K, Hyland S, Thabet P. Pictograms for safer medication management by health care workers. Can J Hosp Pharm. 2016;69(4):286–93. 
4 Dean B, Schecter M, Vincent C, Barber N. Prescribing errors in hospital inpatients: their incidence and clinical significance. Qual Saf Heal Care. 2002;11(4):340–4.
5 Ghaleb MA, Barber N, Franklin BD, Wong ICK. The incidence and nature of prescribing and medication administration errors in paediatric inpatients. Arch Dis Child. 2010;95(2):113–8.
6 Ehrmann O. Les erreurs médicamenteuse en pédiatrie hospitalière [dissertation]. Lyon (France): Université de Lyon; 2012.
7 Keers RN, Williams SD, Cooke J, Ashcroft DM. Causes of medication administration errors in hospitals: a systematic review of quantitative and qualitative evidence. Drug Saf. 2013;36(11):1045–67.
8 Reporting and learning systems for medication errors: the role of pharmacovigilance centres. Geneva (Switzerland): World Health Organization; 2014.
9 Holdsworth MT, Fichtl RE, Raisch DW, Hewryk A, Behta M, Mendez-Rico E, et al. Impact of computerized prescriber order entry on the incidence of adverse drug events in pediatric inpatients. Pediatrics. 2007;120(5):1058–66.
10 James KL, Barlow D, McArtney R, Hiom S, Roberts D, Whittlesea C. Incidence, type and causes of dispensing errors: a review of the literature. Int J Pharm Pract. 2009;17(1):9–30.
11 Lapkin S, Levett-Jones T, Chenoweth L, Johnson M. The effectiveness of interventions designed to reduce medication administration errors: a synthesis of findings from systematic reviews. J Nurs Manag. 2016;24(7):845–58.
12 Montagne M. Pharmaceutical pictograms: a model for development and testing for comprehension and utility. Res Soc Adm Pharm. 2013;9(5):609–20.
13 Spinillo CG. Graphic and cultural aspects of pictograms: an information ergonomics viewpoint. Work. 2012;41 Suppl 1:3398–403.
14 Mansoor LE, Dowse R. Design and evaluation of a new pharmaceutical pictogram sequence to convey medicine usage. Ergon SA. 2004;16(2):29–41.
15 Choi J. Literature review: Using pictographs in discharge instructions for older adults with low-literacy skills. J Clin Nurs. 2011;20(21–22):2984–96.
16 Dowse R, Ehlers MS. The evaluation of pharmaceutical pictograms in a low-literate South African population. Patient Educ Couns. 2001;45(2):87–99.
17 Ai W, Lu X, Liu X, Wang N, Huang G, Mei Q. Untangling emoji popularity through semantic embeddings. In: Proceedings of the 11th International Conference on Web and Social Media; 2017 May 15–18; Montréal (QC). Palo Alto (CA): The AAAI Press; 2017. p. 2–11.
18 Ljubešić N, Fišer D. A global analysis of emoji usage. In: Proceedings of the 10th Web as Corpus Workshop (WAC-X) and the EmpiriST Shared Task; 2016 Aug 7–12; Berlin, Germany. Stroudsburg (PA): Association for Computational Linguistics; 2016. p. 82–9.
19 Sojourner RJ, Wogalter MS. The influence of pictorials on evaluations of prescription medication instructions. Ther Innov Regul Sci. 1997;31(3): 963–72.
20 Pascuet E, Dawson J, Vaillancourt R. A picture worth a thousand words: the use of pictograms for medication labelling. Int Pharm J. 2008;23(1):1–4.
21 WHMIS pictograms 2015. Hamilton (ON): Canadian Centre for Occupational Health and Safety; 2015.
22 Technical Committee, Graphical Symbols (ISO/TC 145). ISO 9186-1:2014. Graphical symbols — test methods — part 1: method for testing comprehensibility. Geneva (Switzerland): International Organization for Standardization; 2014.
23 Johansen JD, Larsen SE. Signs in use: an introduction to semiotics. New York (NY): Routledge; 2002.
24 Hsu CC, Sandford BA. The Delphi technique: making sense of consensus. Pract Assess Res Eval. 2007;12(10):1–8.
25 Harris PA, Taylor R, Thielke R, Payne J, Gonzalez N, Conde JG. Research electronic data capture (REDCap) – a metadata-driven methodology and workflow process for providing translational research informatics support. J Biomed Inform. 2009;42(2):377–81.
26 Hwang SW, Tram CQN, Knarr N. The effect of illustrations on patient comprehension of medication instruction labels. BMC Fam Pract. 2005; 6(1):26.
27 Cahill MC. Design features of graphic symbols varying in interpretability. Percept Motor Skills. 1976;42(2):647–53.
28 Davies S, Haines H, Norris B, Wilson JR. Safety pictograms: are they getting the message across? Appl Ergon. 1998;29(1):15–23.
Competing interests: None declared. ( Return to Text )
Funding: None received. ( Return to Text )
Canadian Journal of Hospital Pharmacy, VOLUME 71, NUMBER 4, July-August 2018