
Lydia R Rahem, Bénédicte Franck, Hélène Roy, Denis Lebel, Philippe Ovetchkine, Jean-François BussièresABSTRACT
Background
Antimicrobial stewardship is a standard practice in health facilities to reduce both the misuse of antimicrobials and the risk of resistance.
Objective
To determine the profile of antimicrobial use in the pediatric population of a university hospital centre from 2015/16 to 2018/19.
Methods
In this retrospective, descriptive, cross-sectional study, the pharmacy information system was used to determine the number of days of therapy (DOTs) and the defined daily dose (DDD) per 1000 patient-days (PDs) for each antimicrobial and for specified care units in each year of the study period. For each measure, the ratio of 2018/19 to 2015/16 values was also calculated (and expressed as a proportion); where the value of this proportion was ≤ 0.8 or ≥ 1.2 (indicating a substantial change over the study period), an explanatory rating was assigned by consensus.
Results
Over the study period, 94 antimicrobial agents were available at the study hospital: 70 antibiotics (including antiparasitics and antituberculosis drugs), 14 antivirals, and 10 antifungals. The total number of DOTs per 1000 PDs declined from 904 in 2015/16 to 867 in 2018/19. The 5 most commonly used antimicrobials over the years, expressed as minimum/maximum DOTs per 1000 PDs, were piperacillin-tazobactam (78/105), trimethoprim-sulfamethoxazole (74/84), ampicillin (51/69), vancomycin (53/68), and cefotaxime (55/58). In the same period, the care units with the most antimicrobial use (expressed as minimum/maximum DOTs per 1000 PDs) were hematology-oncology (2529/2723), pediatrics (1006/1408), and pediatric intensive care (1328/1717).
Conclusions
This study showed generally stable consumption of antimicrobials from 2015/16 to 2018/19 in a Canadian mother-and-child university hospital centre. Although consumption was also stable within drug groups (antibiotics, antivirals, and antifungals), there were important changes over time for some individual drugs. Several factors may explain these variations, including disruptions in supply, changes in practice, and changes in the prevalence of infections. Surveillance of antimicrobial use is an essential component of an antimicrobial stewardship program.
KEYWORDS: antimicrobial stewardship, antimicrobial therapy, defined daily dose, treatment duration, pediatrics
RÉSUMÉ
Contexte
La gestion des antimicrobiens est une pratique courante dans les centres hospitaliers afin de réduire l’utilisation inappropriée des antimicrobiens et le risque de résistance.
Objectif
Décrire l’évolution de l’utilisation des antimicrobiens dans un centre hospitalier universitaire de 2015–16 à 2018–19.
Méthodes
Dans cette étude rétrospective, descriptive et transversale, les dossiers pharmacologiques ont servi à déterminer le nombre de jours de traitement (NJT) et la dose définie journalière (DDD) par 1000 jours-présence (JP) pour chaque antimicrobien et pour chaque unité de soins par année de l’étude. Pour chaque mesure, on a également comparé le ratio de 2018–19 à celui de 2015–16, qui est exprimé en proportion; lorsque la valeur de cette proportion était ≤ 0,8 ou ≥ 1,2, ce qui indiquait un changement important durant la période de l’étude, une note explicative a été attribuée par consensus.
Résultats
Durant la période à l’étude, 94 antimicrobiens ont été disponibles dans notre centre : 70 antibiotiques (dont les antiparasitaires et les antituberculeux), 14 antiviraux et 10 antifongiques. Le nombre total de NJT par 1000 JP a diminué de 904 en 2015–16 à 867 en 2018–19. Les cinq antimicrobiens utilisés le plus fréquemment et présentés en minimum / maximum de NJT par 1000 JP étaient les suivants : piperacilline-tazobactam (78/105), trimethoprim-sulfamethoxazole (74/84), ampicilline (51/69), vancomycine (53/68) et cefotaxime (55/58). Pendant la même période, les unités de soins qui faisaient la plus grande utilisation d’antimirobiens (exprimée en minimum / maximum de NJT par 1000 JP) étaient hématologie-oncologie (2529/2723), pédiatrie (1006/1408) et soins intensifs pédiatriques (1328/1717).
Conclusions
Cette étude démontre une consommation stable d’antimicrobiens entre 2015–16 et 2018–19 dans un centre hospitalier universitaire mère-enfant canadien. Malgré le fait que la consommation entre les groupes d’antimicrobiens (antibiotiques, antiviraux, antifongiques) était stable, on a constaté d’importantes variations concernant certains médicaments individuels. Plusieurs facteurs peuvent expliquer cette variation, notamment des ruptures d’approvisionnement, des changements de pratique et des changements dans la prévalence d’infections. La surveillance de la consommation des antimicrobiens est une partie essentielle de tout programme d’antibiogouvernance.
MOTS CLÉS: antibiogouvernance, antibiothérapie, dose définie journalière, durée de traitement, pédiatrie
The World Health Organization and other agencies have correlated antimicrobial use with the development of bacterial resistance to antibiotics.1–3 As such, information about antimicrobial use is integral to defining the priorities of health system stakeholders at the regional, provincial, territorial, national, and global levels.1–3
To limit bacterial resistance to antibiotics, a comprehensive international antimicrobial resistance action program, in which Canada is a key player, was adopted in 2015.1,4 To support this initiative, a pan-Canadian antimicrobial resistance surveillance system was established in 2017,4 and Accreditation Canada has made antimicrobial stewardship a required organizational practice.5 Appropriate use of antimicrobials may help to slow the development of resistance.6–8 In the province of Quebec, an administrative directive came into effect in 2011 requiring that each health facility survey its use of antibiotics.9 Extraction and analysis of the number of days of therapy (DOTs) per patient-day (PD) and the number of defined daily doses (DDDs) per PD are mandatory.10–12 This study aimed to describe the profile of antimicrobial use in the pediatric population of a university hospital centre from 2015/16 to 2018/19. These data will allow the antimicrobial stewardship program of the facility to explore trends in its pediatric population and will generate a basis for future comparisons.
The main objective of this retrospective, descriptive, cross-sectional study was to profile the use of antimicrobials in the pediatric population of a university hospital centre—specifically, the CHU Sainte-Justine, a 500-bed tertiary care mother-and-child facility in Montréal, Quebec—from 2015/16 to 2018/19. The research protocol was approved by the institution’s research ethics board.
We collected data for the following pediatric inpatient care units: surgery, neonatology, hematology-oncology, pediatrics, psychiatry, rehabilitation, and pediatric intensive care. All patients on these care units were 18 years of age or younger. The obstetrics and gynecology and nursery units were excluded.
All doses of systemic (oral and parenteral) antimicrobials dispensed daily to hospital inpatients between April 1, 2015, and March 31, 2019, were included. Antimicrobial doses administered by nebulization or by topical application were excluded because our pharmacy information system cannot provide reliable data for these routes of administration.
The DDDs used for this study were obtained from the WHO’s ATC/DDD Index.13 For antimicrobials with reference DDDs using a unit of measure different from the one used locally, we established conversion factors based on the scientific literature.
The numbers of PDs in each care unit and overall were extracted from the periodic statistical profile of admissions, discharges, and transfers within the institution.
We extracted antimicrobial consumption data from the institution’s pharmacy information system (GesphaRx, CGSI Solutions TI Inc). More specifically, we used Structured Query Language queries to determine the number of DOTs and DDDs for each antimicrobial and for each care unit.
From these data, we first established the profile of admission volume, number of DOTs, and number of DDDs. We then calculated, for each antimicrobial, the number of DOTs per 1000 PDs and the number of DDDs per 1000 PDs in each year of the study period (2015/16 to 2018/19). We also established the number of DDDs and the number of DOTs per 1000 PDs by care unit for each year. For each measure, we compared the values for the first and last years of the study; the comparison was calculated as the ratio of the value in the last year to the value in the first year, expressed as a proportion. Any proportion ≤ 0.8 or ≥ 1.2 was deemed, by consensus, to represent a substantial variation over time requiring assessment by the antimicrobial stewardship committee. For cases in which the value of DOT or DDD in 2015/16 was zero, a value of 0.1 was arbitrarily assigned to allow calculation of the ratio in relation to 2018/19 (given that the value for 2015/16 appears in the denominator for calculating this ratio). To explain changes in the ratio from the first to last years of the study period, we assigned a rating based on the following choices: out of stock, change in practice, change in prevalence of the infection, no explanation identified, or variation not substantial.
Only descriptive statistical analyses were performed.
From 2015/16 to 2018/19, a total of 94 antimicrobials were listed in our local drug formulary: 70 antibiotics (including antiparasitics and antituberculosis drugs), 14 antivirals, and 10 antifungals. Detailed results are not presented for the 32 of these 94 antimicrobials that were not used during the study period.
Table 1 shows that admission volumes, as well as numbers of DOTs and DDDs, remained constant over the study period.
TABLE 1 Profile of Admission Volumes, Days of Therapy (DOTs), and Defined Daily Doses (DDDs)
Table 2 presents the number of DOTs per 1000 PDs for the individual antimicrobials used in each year in the study period. The 5 most commonly used antimicrobials over the years (in terms of DOTs per 1000 PDs) were piperacillin-tazobactam, trimethoprim-sulfamethoxazole, ampicillin, vancomycin, and cefotaxime. There was no substantial variation over time for all antimicrobials as a group (ratio 1.0 for comparison of last year to first year of the study period) or by therapeutic class (ratio 1.0 for antibiotics, 1.1 for antivirals, 0.9 for antifungals). However, there were substantial changes in consumption (i.e., ratio ≤ 0.8 or ≥ 1.2 over time) for 33 of the 70 antibiotics in the formulary (47%), 9 of the 14 antivirals (64%), and 8 of the 10 antifungals (80%). For the 50 drugs with substantial changes, as reported in Table 2, the following reasons were assigned, with some drugs having more than one reason for the observed change: drugs being out of stock (8/50), a change in practice (22/50), a change in the prevalence of infection (10/50), or no explanation (17/50). The remaining 12 medications listed in Table 2 did not show any substantial change over time.
TABLE 2 Number of Days of Therapy (DOTs) per 1000 Patient-Days (PDs) by Antimicrobial, 2015/16 to 2018/19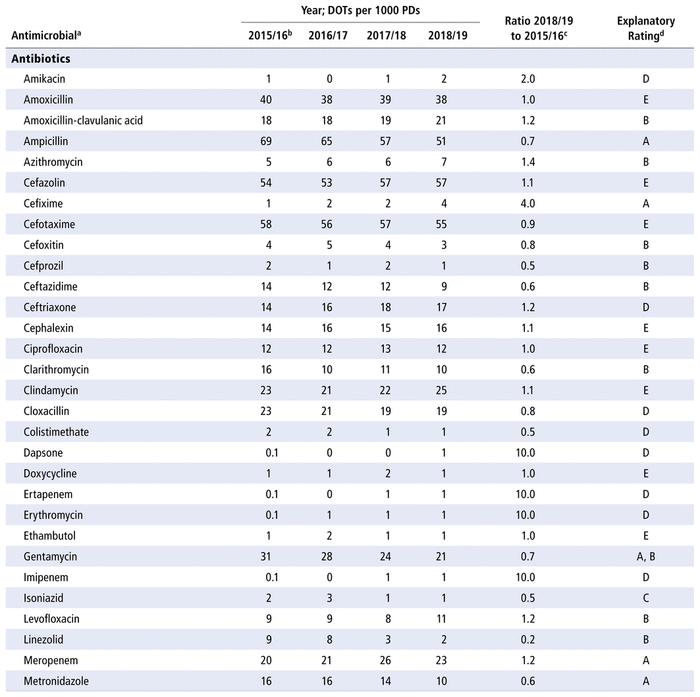
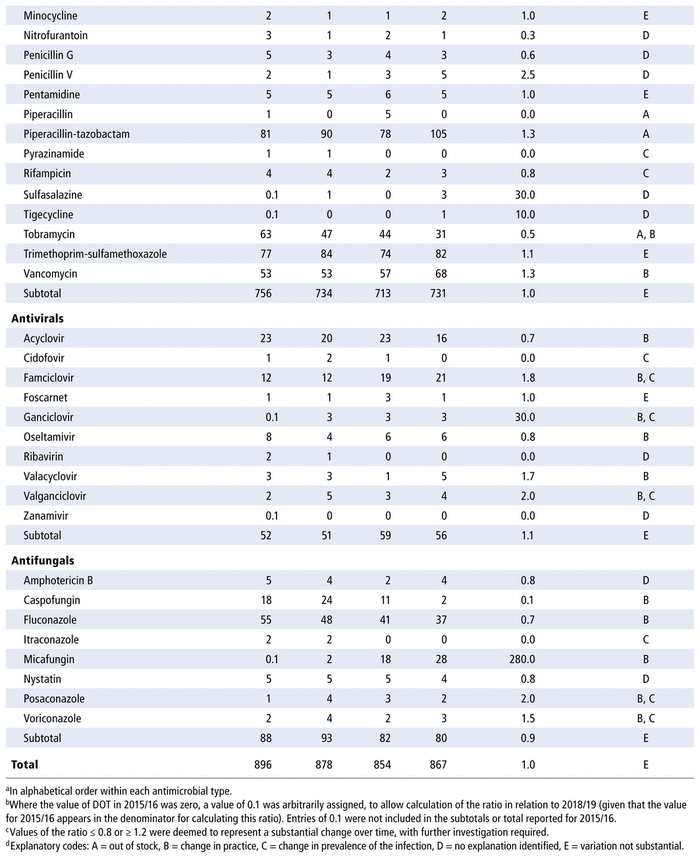
Table 3 presents the number of DDDs per 1000 PDs for the individual antimicrobials used in each year in the study period. As for DOTs, there was no substantial variation over time for all antimicrobials as a group (ratio 1.0 for comparison of last year to first year of the study period) or by therapeutic class (ratio 1.0 for antibiotics, 0.9 for antivirals, 0.9 for antifungals). However, there were substantial changes in consumption (i.e. ratio ≤ 0.8 or ≥ 1.2 over time) for 32 of the 70 listed in the formulary (46%), 8 of the 14 antivirals (57%), and 8 of the 10 antifungals (80%). For the 48 drugs with substantial changes, as reported in Table 3, the following reasons were assigned, with some drugs having more than one reason for the observed change: drugs being out of stock (8/48), a change in practice (16/48), a change in the prevalence of infection (10/48) and no explanation (20/48). The remaining 14 medications listed in Table 3 did not show any substantial change over time.
TABLE 3 Defined Daily Doses (DDDs) per 1000 Patient-Days (PDs) by Antimicrobial, 2015/16 to 2018/19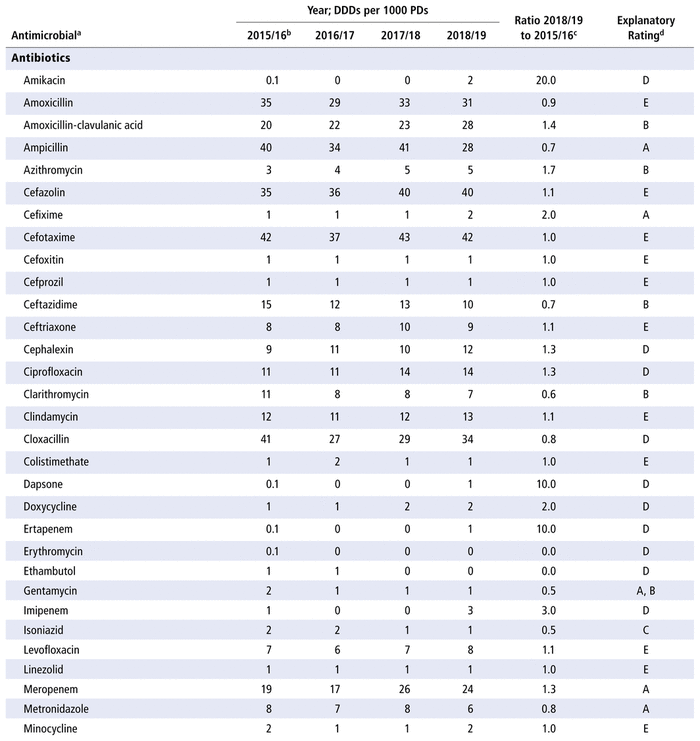
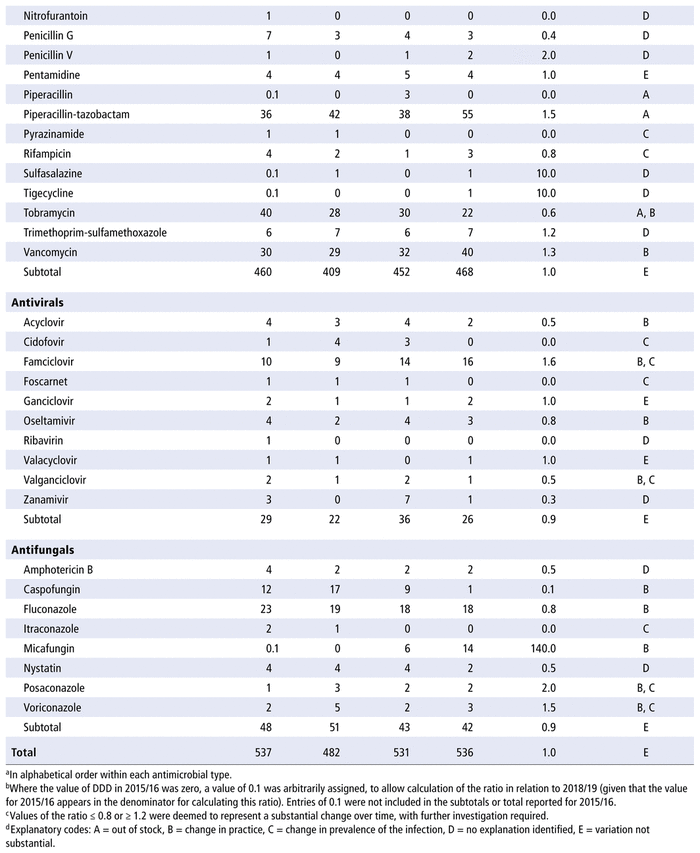
Table 4 presents the numbers of DOTs and DDDs per 1000 PDs by care unit from 2015/16 to 2018/19. The care units with the most antimicrobial use over the study period (in terms of DOTs per 1000 PDs) were hematology-oncology, pediatrics, and pediatric intensive care. The numbers of DOTs per 1000 PDs and DDDs per 1000 PDs in the surgical unit were reduced by half over the 4 years of the study, whereas a 40% increase in these measures was observed in the pediatrics unit.
TABLE 4 Days of Therapy (DOTs) and Defined Daily Doses (DDDs) per 1000 Patient-Days (PDs), by Care Unit, 2015/16 to 2018/19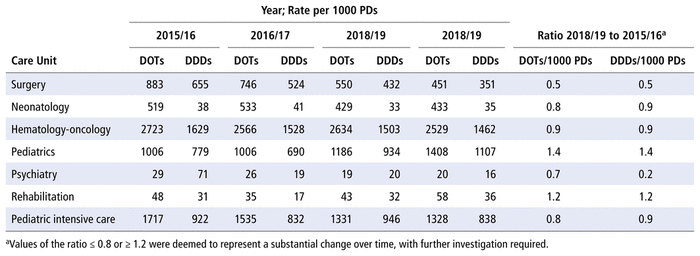
In this descriptive study, we have presented a profile of antimicrobial use for the pediatric population of a university hospital centre over the period 2015/16 to 2018/19. The data reported here have been presented and discussed with the hospital’s antimicrobial stewardship committee, the pharmacology and therapeutics committee, and groups of clinicians (e.g., physicians, pharmacists) in the form of an annual report.14,15
The results of this study highlight that antimicrobial consumption was stable from 2015/16 to 2018/19 and was also stable for 3 specific groups of drugs (i.e., antibiotics, antivirals, and antifungals). Despite this overall stability, the use of certain broad-spectrum antimicrobials increased from 2015/16 to 2018/19 (e.g., for piperacillin-tazobactam, from 81 to 105 DOTs per 1000 PDs; for meropenem, from 20 to 23 DOTs per 1000 PDs; for ertapenem, from 0.1 to 1 DOTs per 1000 PDs). The misuse of broad-spectrum antimicrobials contributes to the development of antimicrobial resistance. However, within the various groups of drugs, there were substantial variations in use for many individual antimicrobials. There may be different reasons for such variations. Given the pediatric study population, these variations are discussed here with reference only to the data for DOTs per 1000 PDs. (The Results section above presents data for DDDs per 1000 PDs as well, because these values are used for inter-institutional comparisons and because this is the standard measure used for the adult population.)
Some of the variations in use of particular antimicrobials over time were attributed to stock shortages; such shortages will generally lead to a decline in the use of the antimicrobial that is in short supply and a corresponding increase in the use of an alternative drug. For example, the DOTs per 1000 PDs increased over time for cefixime (from 1 in 2015/16 to 4 in 2018/19) because there was a shortage of this cephalosporin from July 2014 to September 2015, at the start of the study period. Cephalexin (increase from 14 to 16 DOTs per 1000 PDs from 2015/16 to 2018/19) and amoxicillin-clavulanic acid (increase from 18 to 21 DOTs per 1000 PDs) were used as alternatives to cefixime during the study period. The increase in use of piperacillin-tazobactam (from 81 to 105 DOTs per 1000 PDs from 2015/16 to 2018/19) was related to a partial disruption in stocking this combination medication from 2015 to 2017. This shortage contributed to the higher initial use and subsequent decline in use of gentamycin (gradual decrease from 31 DOTs per 1000 PDs in 2015/16 to 21 DOTs per 1000 PDs in 2018/19), tobramycin (gradual decrease from 63 to 31 DOTs per 1000 PDs), and metronidazole (gradual decrease from 16 to 10 DOTs per 1000 PDs), as well as a peak in use of the carbapenem drugs (e.g., for meropenem, 26 DOTs per 1000 PDs in 2017/18; for imipenem, 1 DOT per 1000 PDs in 2017/18 and 2018/19).
Another explanatory factor that we considered involved changes in practice related to the evolution of scientific knowledge, the arrival of new practitioners, and local discussions involving the pharmacology and therapeutics committee and the chief of the pharmacy department. For example, an increase in the use of azithromycin (from 5 to 7 DOTs per 1000 PDs over the study period) was attributable to this drug’s anti-inflammatory properties, especially for patients with cystic fibrosis. The increased use of azithromycin in otorhinolaryngology led to a corresponding reduction in the use of clarithromycin (from 16 to 10 DOTs per 1000 PDs). Furthermore, following a change in internal protocol, there was a decrease in the use of ceftazidime (from 14 to 9 DOTs per 1000 PDs) in favour of piperacillin-tazobactam among patients with febrile neutropenia.16 Finally, the use of linezolid declined (from 9 to 2 DOTs per 1000 PDs) in favour of vancomycin (from 53 to 68 DOTs per 1000 PDs) with the help of a change of protocol. For some years, linezolid has been preferred over vancomycin for treating sepsis in neonatology (given the presence of coagulase-negative staphylococci with reduced susceptibility to vancomycin); however, resistance monitoring has demonstrated the possibility of returning to vancomycin, which has a safer therapeutic index in the pediatric population. There was also an increase in the use of micafungin (from 0.1 to 28 DOTs per 1000 PDs), with a corresponding decrease in the use of caspofungin (from 18 to 2 DOTs per 1000 PDs). Micafungin has a similar efficacy, its use relies on the availability of more safety data for the pediatric population, and it has replaced caspofungin on the study facility’s formulary.17,18 Finally, there was a decrease in the use of fluconazole (from 55 to 37 DOTs per 1000 PDs), also in favour of the echinocandins (e.g., micafungin).19
Another reason for changes in the use of certain antimicrobials was a change in the prevalence of certain infections in the study institution. These changes in prevalence were not necessarily experienced at the regional or provincial level. Evolution in the organization of care sometimes leads to shifts in the locations where certain patient groups are treated. For example, there were decreases in the use of isoniazid (from 2 to 1 DOT per 1000 PDs), as well as pyrazinamide and rifampicin, because of the limited number of cases of tuberculosis that were being followed within our institution.20 There were also slight increases in the use of posaconazole and voriconazole, observed when the institution treated sporadic cases of invasive infection with Aspergillus spp.21 and other filamentous fungi. Finally, there were slight changes in the use of cidofovir, foscarnet, ganciclovir, and valganciclovir because of the limited and variable number of patients with cytomegalovirus infection.22
Regarding changes in use by particular care units over the study period, we found increases in the use of antimicrobials in the pediatrics unit (ratio of 2018/19 to 2015/16 = 1.4) and the rehabilitation unit (ratio 1.2). In theory, these increases could be explained by the admission of patients with more complex health problems to the infectious disease and solid organ transplant units. The decrease in DOTs per 1000 PDs in the surgical unit (ratio 0.5) may be related to increased use of polyvalent antimicrobials (such as piperacillin-tazobactam), which generate fewer DOTs than a combination of 3 agents (such as ampicillin, gentamycin, and metronidazole), as well as to changes in internal protocols to reduce the number of postoperative days in hospital.
This study follows a previous study conducted in our institution for the period 2011/12 to 2014/15.23 In a comparison of the current results with the data from that previous study, we note that the overall number of DOTs per 1000 PDs has decreased from 1068 in 2010/11 to 867 in 2018/19. This substantial decrease is likely related to the effects of the antimicrobial stewardship program (under the direction of the pharmacy and therapeutics committee), which includes targeted interventions for physicians and pharmacists. The decrease in DOTs per 1000 PDs is also associated with increased use of monotherapy rather than combinations of antimicrobials (e.g., piperacillin-tazobactam replacing the triple combination of ampicillin [93.3 DOTs per 1000 PDs in 2010/11 versus 51 DOTs per 1000 PDs in 2018/19], gentamycin [85 versus 21 DOTs per 1000 PDs, respectively], and metronidazole [23.3 versus 10 DOTs per 1000 PDs, respectively]). Antimicrobial stewardship programs need to closely monitor the impact of such changes, since they increase the use of broad-spectrum antibiotics.
This descriptive study had certain limitations. The study was based on antimicrobial dispensing data, but a dispensed dose may not be administered to the patient, for example because of discharge or a change in therapy. Thus, dispensing data may slightly overestimate the number of doses administered. A complete analysis of antimicrobial use should take into account each patient’s clinical condition (e.g., therapeutic response, occurrence of adverse effects). The use of DOTs and DDDs per 1000 PDs provides a general profile of usage. The antimicrobial stewardship committee must conduct additional reviews to investigate changes in the use of particular drugs over time that are more difficult to explain.
This study has highlighted stable consumption of antimicrobials from 2015/16 to 2018/19 in a Canadian mother-and-child university hospital centre. Although consumption was stable by type of drug (antibiotics, antivirals, antifungals), there were important variations for some antimicrobials. Several factors can explain these variations, including supply disruptions, changes in practice, and changes in the prevalence of infections. Surveillance of antimicrobial use is an essential component of an antimicrobial stewardship program. This study has provided a comprehensive basis of comparison for antimicrobial stewardship programs interested in studying antimicrobial use in their respective pediatric populations.
1 WHO report on surveillance of antibiotic consumption: 2016–2018 early implementation. World Health Organization; 2018 [cited 2019 Aug 1]. Available from: https://www.who.int/medicines/areas/rational_use/oms-amr-amc-report-2016-2018/en/
2 Antimicrobial resistance: global report on surveillance 2014. World Health Organization; 2014 [cited 2019 Aug 1]. Available from: https://www.who.int/drugresistance/documents/surveillancereport/en/
3 Antimicrobial resistance and use in Canada: a federal framework for action. Public Health Agency of Canada; 2014 [cited 2019 Aug 1]. Available from: https://www.canada.ca/content/dam/canada/health-canada/migration/healthy-canadians/alt/pdf/drugs-products-medicaments-produits/buying-using-achat-utilisation/antibiotic-resistance-antibiotique/antimicrobial-framework-cadre-antimicrobiens-eng.pdf
4 Canadian antimicrobial resistance surveillance system: 2017 report. Public Health Agency of Canada; 2018 [cited 2019 Aug 1]. Available from: https://www.canada.ca/content/dam/phac-aspc/documents/services/publications/drugs-health-products/canadian-antimicrobial-resistance-surveillance-system-2017-report-executive-summary/CARSS-Report-2017-En.pdf
5 Required organizational practices handbook. Accreditation Canada; 2020 [cited 2020 Nov 20]. Available for purchase from: https://store.accreditation.ca/products/required-organizational-practices-handbook-2017-version-2
6 Zhang Z, Chen F, Chen J. Introducing an antibiotic stewardship program in a pediatric center in China. World J Pediatr. 2018;14(3):274–9.
Crossref PubMed
7 Aizawa Y, Suwa J, Higuchi H, Fukuoka K, Furuichi M, Kaneko T, et al. Antimicrobial stewardship program in a pediatric intensive care unit. J Pediatr Infect Dis Soc. 2018;7(3):e156–9.
Crossref
8 Nzegwu N, Rychalsky M, Nallu L, Song X, Deng Y, Natusch A, et al. Implementation of an antimicrobial stewardship program in a neonatal intensive care unit. Infect Control Hosp Epidemiol. 2017;38(10):1137–43.
Crossref PubMed
9 Mise en œuvre d’un programme de surveillance de l’usage des antibiotiques en établissement de santé. Ministre de la Santé et des Services sociaux [Quebec]; 2011 [cited 2019 Aug 1]. Available from: http://msssa4.msss.gouv.qc.ca/fr/document/d26ngest.nsf/dfeaec2f73c3d1c68525656b00163b18/64dda98c0e305cc4852578b70065be3c/$FILE/2011-021_Circulaire%20(2011-06-10).pdf
10 Guidelines for ATC classification and DDD assignment. WHO Collaborating Centre for Drug Statistics Methodology; 2019 [cited 2020 Nov 18]. Available from: https://www.whocc.no/atc_ddd_index_and_guidelines/guidelines/
11 Ibrahim O, Polk R. Antimicrobial use metrics and benchmarking to improve stewardship outcomes. Infect Dis Clin North Am. 2014;28(2): 195–214.
Crossref PubMed
12 Fortin É, Fontela P, Manges A, Platt R, Buckeridge D, Quach C. Measuring antimicrobial use in hospitalized patients: a systematic review of available measures applicable to paediatrics. J Antimicrob Chemother. 2014;69(6):1447–56.
Crossref PubMed
13 ATC/DDD index. WHO Collaborating Centre for Drug Statistics Methodology; 2019 [cited 2019 Aug 1]. Available from: https://www.whocc.no/atc_ddd_index/
14 Guillot J, Bérard C, Roy H, Ovetchkine P, Lebel D, Bussières JF. Surveillance des antimicrobiens : élaboration d’un rapport type : l’expérience d’un CHU mère-enfant. Pharmactuel. 2014;47:210–3.
15 Bérard C, Froger-Guillot J, Roy H, Ovetchkine P, Lebel D, Bussières JF. L’expérience d’un CHU mère-enfant en gérance des antimicrobiens : données sources et traitement de données aux fins d’élaborer un rapport de surveillance. Annales de l’Unité de recherche en pratique pharmaceutique 2014 Nov 6 [cited 2019 Aug 1]: 1–10. Available from: www.indicible.ca/urpp/20141106_DDD8a_Annales.pdf
16 Horita N, Shibata Y, Watanabe H, Namkoong H, Kaneko T. Comparison of antipseudomonal β-lactams for febrile neutropenia empiric therapy: systematic review and network meta-analysis. Clin Microbiol Infect. 2017;23(10):723–9.
Crossref PubMed
17 Maximova N, Schillani G, Simeone R, Maestro A, Zanon D. Comparison of efficacy and safety of caspofungin versus micafungin in pediatric allogeneic stem cell transplant recipients: a retrospective analysis. Adv Ther. 2017;34(5):1184–99.
Crossref PubMed
18 Scott L. Micafungin: a review in the prophylaxis and treatment of invasive candida infections in paediatric patients. Pediatr Drugs. 2017; 19(1):81–90.
Crossref
19 Lee C, Lin J, Ho C, Sun M, Yen W, Lin C. Efficacy and safety of micafungin versus extensive azoles in the prevention and treatment of invasive fungal infections for neutropenia patients with hematological malignancies: a meta-analysis of randomized controlled trials. PLoS One. 2017;12(7):e0180050.
Crossref PubMed PMC
20 Tuberculosis country profiles. World Health Organization; 2019 [cited 2019 Aug 1]. Available from: https://www.who.int/teams/global-tuberculosis-programme/data
21 Dufresne S, Cole D, Denning D, Sheppard D. Serious fungal infections in Canada. Eur J Clin Microbiol Infect Dis. 2017;36(6):987–92.
Crossref PubMed
22 Zuhair M, Smit GSA, Wallis G, Jabbar F, Smith C, Devleesschauwer B, et al. Estimation of the worldwide seroprevalence of cytomegalovirus: a systematic review and meta-analysis. Rev Med Virol. 2019;29(3):e2034.
Crossref PubMed
23 Cotteret C, Roy H, Lebel D, Ovetchkine P, Bussières JF. Profil de consommation des antimicrobiens en pédiatrie de 2010–2011 à 2014–2015 : l’expérience d’un centre hospitalier universitaire. Pharmactuel. 2017;50(3):160–8.
Competing interests: None declared. ( Return to Text )
Funding: None received. ( Return to Text )
Canadian Journal of Hospital Pharmacy, VOLUME 74, NUMBER 1, Winter 2021